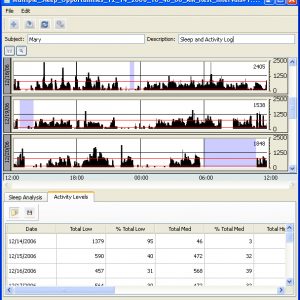
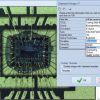


Thresholding images in PAX-it is easy. The particle size analysis software will show a histogram of the color or grayscale distribution and automatically detect objects in the image. From there, users can manually adjust the threshold if they wish.
Once the thresholding step has been performed, particles may be filtered by size, shape, position and other criteria. The entire process just takes a few clicks, and all of the particle data is displayed in PAX-it’s measurement totals window. Detailed data such as area, perimeter, roundness, feret diameter, aspect ratio and much more are available for each particle, immediately on the screen.
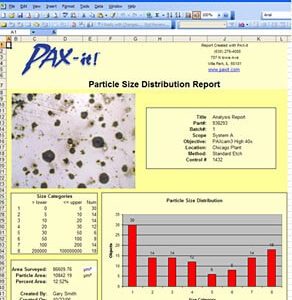
By using PAX-it’s report generation tools, all of the information can quickly be incorporated into a customized Excel Report. Create as many report templates as you want! Templates may be constructed to report raw data, summary statistics, and graphs of the results. PAX-it images, database information, and notes may also be included in the report. The report can be set up to summarize the particle analysis data from one image, or from multiple images!
Creating a particle size distribution report can be set up one time and then reports can easily be generated just by clicking on the images you want in the report.
Advanced Particle Size Analysis Options
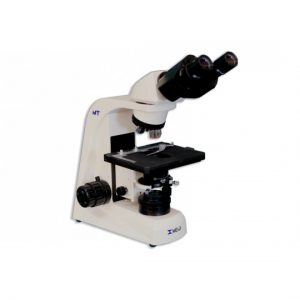
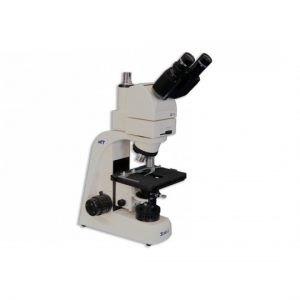
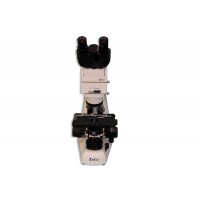
By utilizing PAX-it’s motorized microscope stage module, a seamless workflow can be created to capture and analyze samples repeatedly and accurately. Also by using PAX-it’s extended security module, images and results can be locked and digitally signed.
Whether they are used for semiconductors, metallography, pharmaceutical or biomedical applications, PAX-it’s powerful particle size analysis tools and easy-to-use interface make analyzing the particles in your microstructures quick and simple.